DRA Analysis: 2024 North Carolina voting districts
Common Cause NC has compiled information from Dave’s Redistricting App (DRA) about the new congressional and legislative district maps passed by the Republican-controlled North Carolina legislature for the 2024 elections. NOTE: The analysis here reflects what is generated by Dave’s Redistricting App and does not constitute an opinion or endorsement by Common Cause.
Dave’s Redistricting App is a volunteer-run free online tool to create, view, and analyze legislative maps. DRA uses data about election outcomes from the past several elections to make predictions about how a district will lean.
JUMP TO: Congressional Map | NC Senate Map | NC House Map
2024 NC Congressional Map (CST-4)
Click here to view the full DRA analysis and interactive map.
Here’s what Dave’s Redistricting analysis shows us about the 2024 NC Congressional Map:
Political Demographics
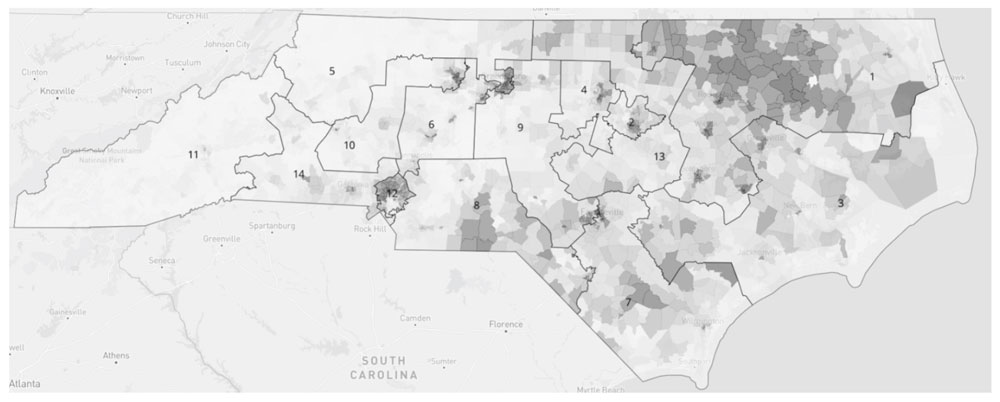
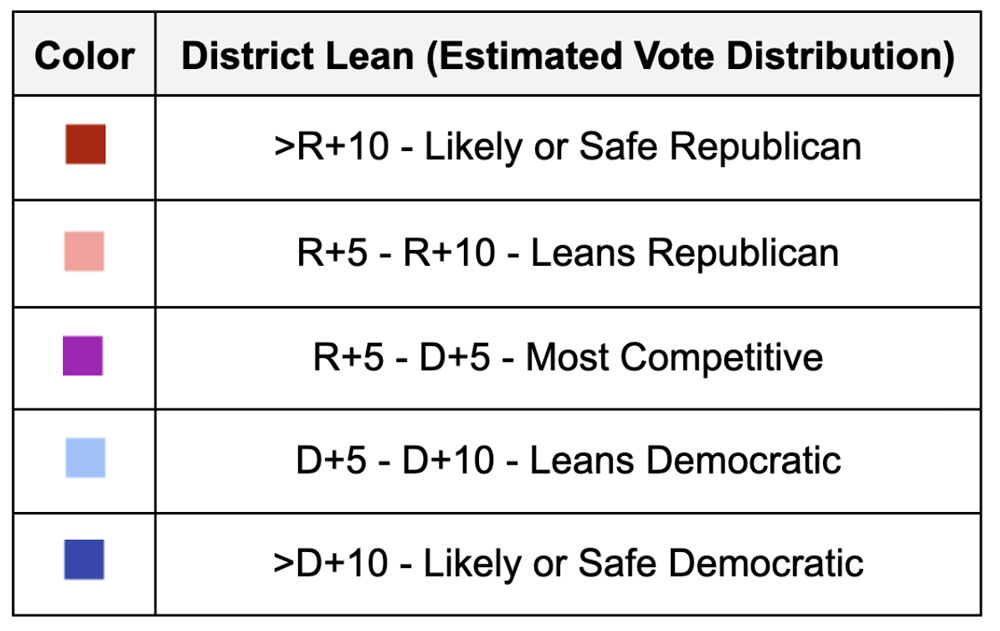
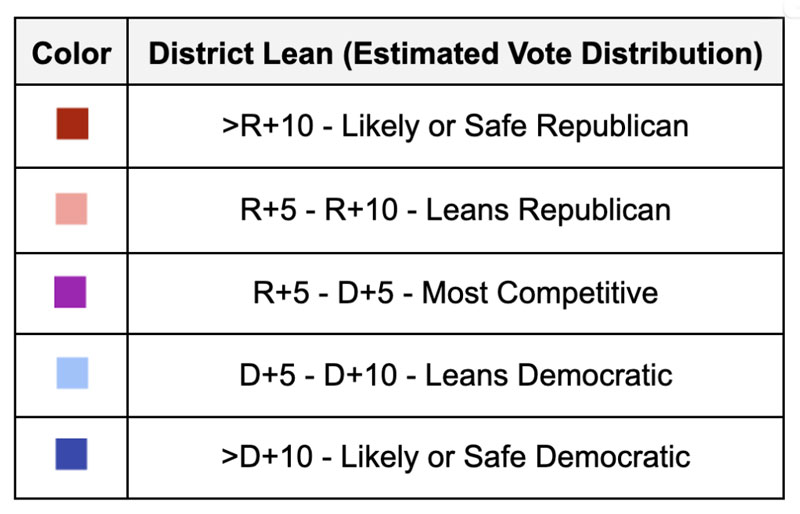
Below is a view of the congressional plan based on composite 2016-2022 election data which combines the results of several elections. The darker the shade of red or blue the safer the seat. The lighter the shade, the less safe the seat is.
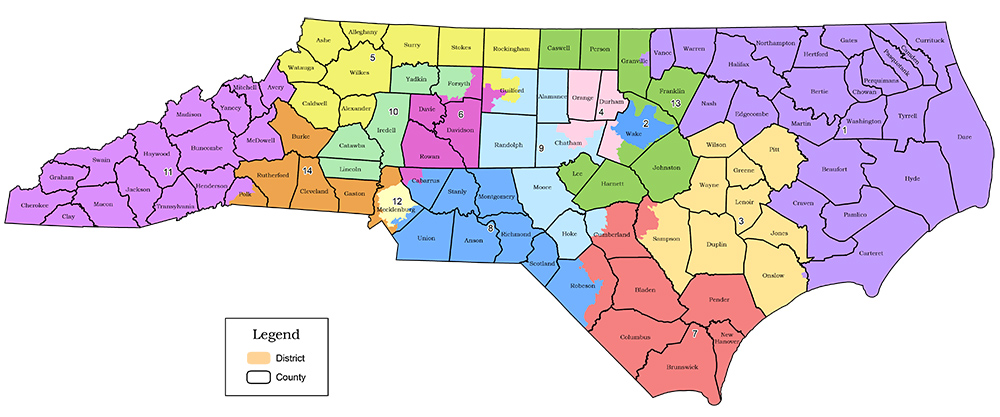
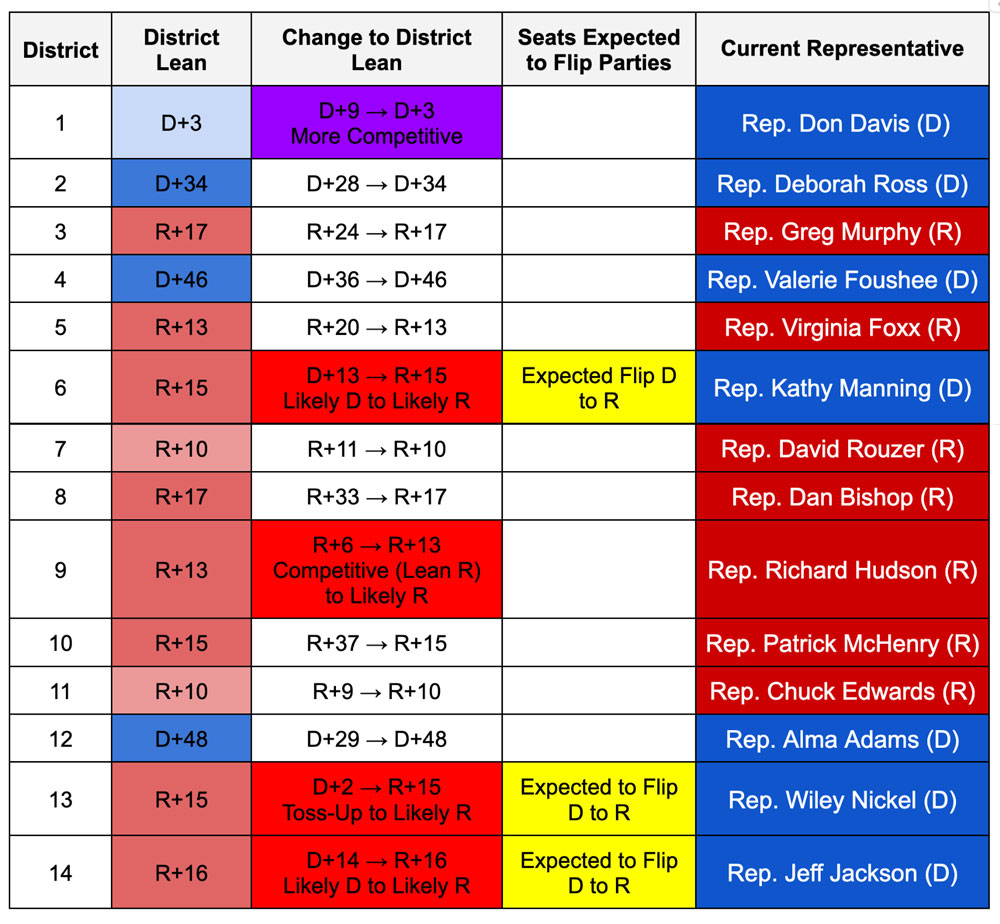
Below is an illustration of the political lean for each congressional district and how the districts are projected to change under the new plan.
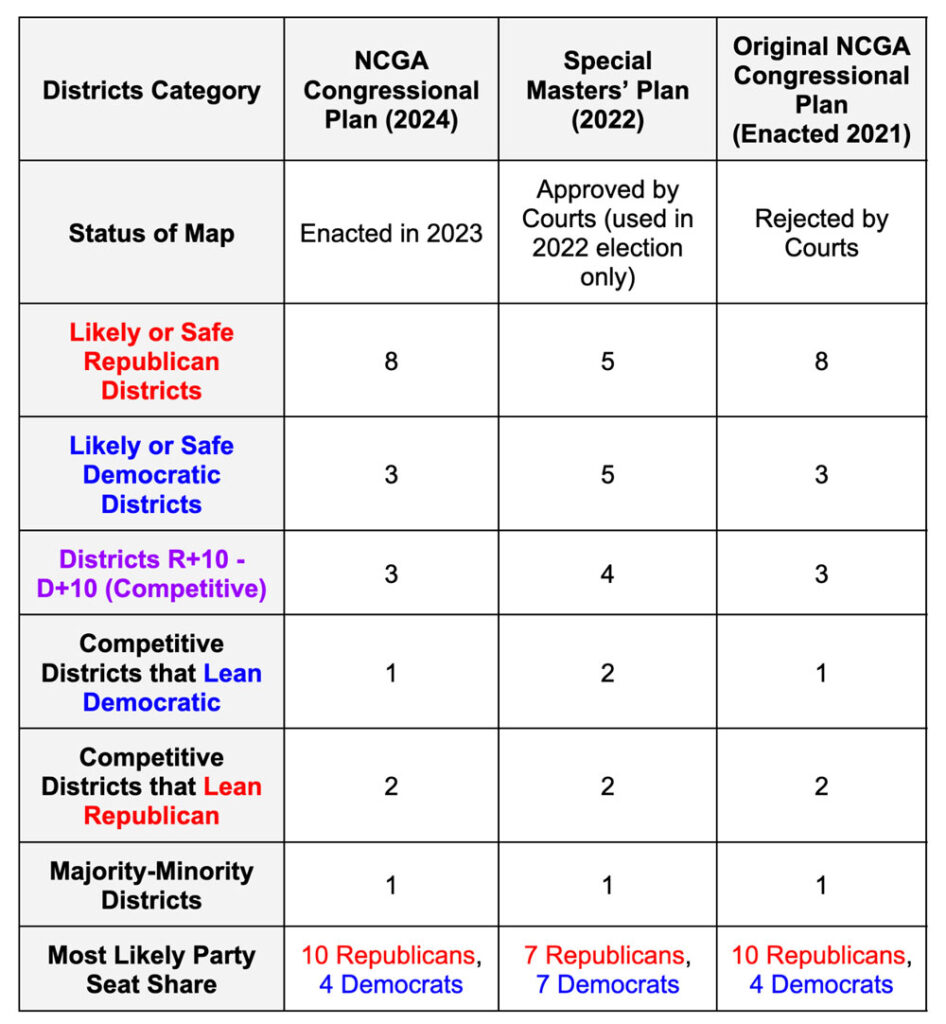
Three of the districts, district 1, district 11, and district 7 are estimated to favor Republicans or Democrats by no more than 10 percentage points. Another way to describe these districts is having a political lean in-between R+10 and D+10. This means these districts do not favor one political party by more than 10 percentage points and may be at least somewhat competitive. District 11 and district 7 are at the edge of the competitive range with a lean of R+10 while district 1 is projected to be quite competitive with a lean of D+3. According to the DRA analysis, the most likely outcome of this map would be a 10-4 split with 10 Republicans and 4 Democrats.
District 1, by far, is expected to be the most competitive district in this plan. With the DRA projected margin in the district being D+3, it is possible for Republicans to win the district and obtain an 11-3 majority in North Carolina’s congressional delegation.
Communities Split
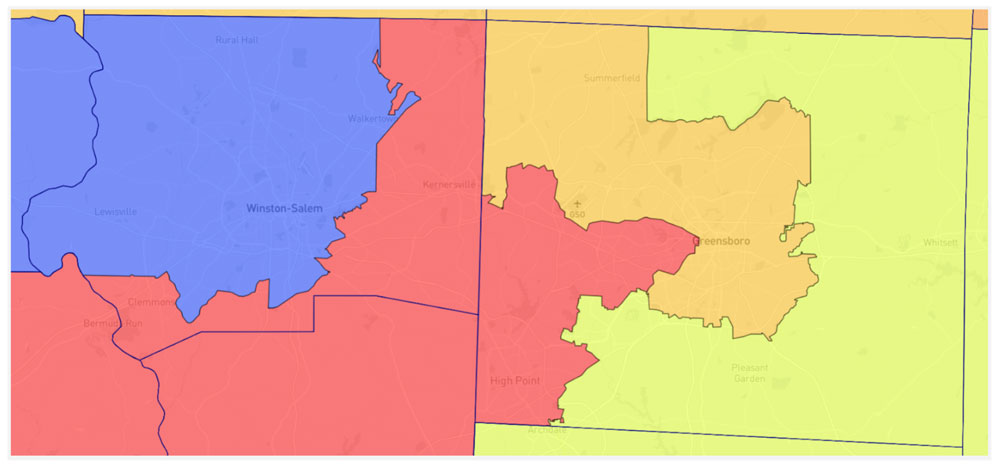
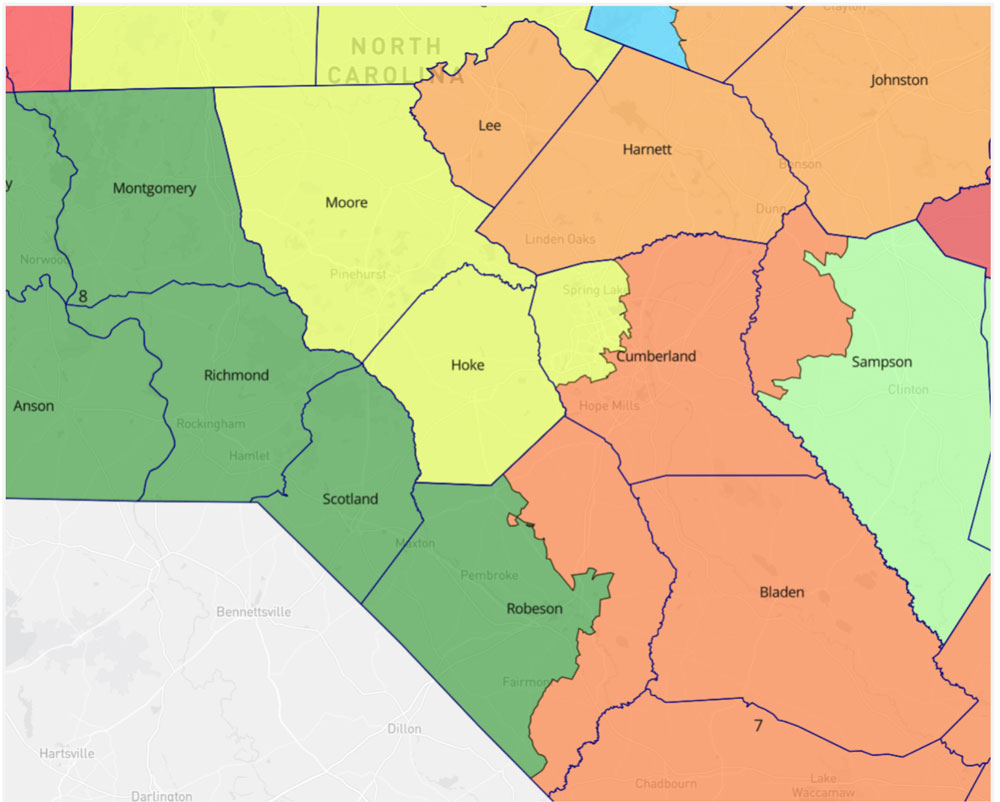
Despite numerous public comments asking for the Triad and Sandhills to be kept together within a congressional district, the North Carolina General Assembly’s enacted congressional map splits both regions into multiple districts. As show below:
Triad in 2024 Congressional Map:
Sandhills in 2024 Congressional Map:
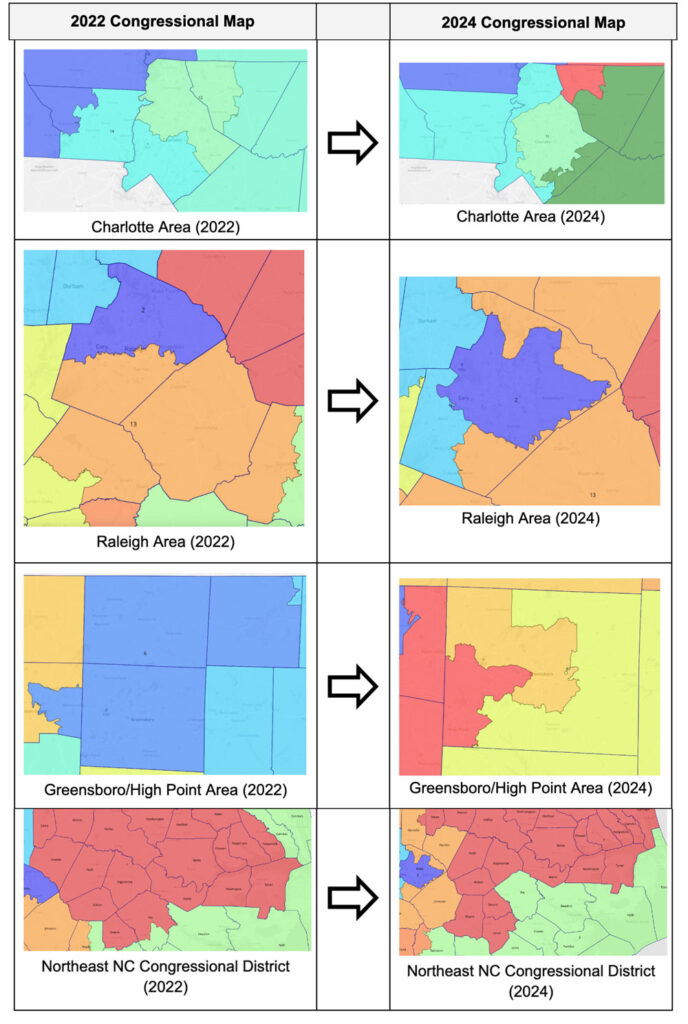
2022 Map vs. 2024 Map
Map makers also chose to split the three largest counties in the state twice. Wake and Mecklenburg counties have to be split once because they contain a population larger than one congressional district. Guilford County does not have to be split.
There was also a change in the northeast congressional district. That district which includes the historic Black belt of Northeastern North Carolina now excludes Pitt County and extends further east to include Currituck and Camden counties.
For a more in-depth comparison between the 2022 maps and the 2024 maps, Click here to use the Redistricting and You tool. You can compare political and racial data. It will also allow you to type in your address to see how your districts have changed.
Racial Demographics
This map shows how North Carolina’s Black population is spread across the districts:
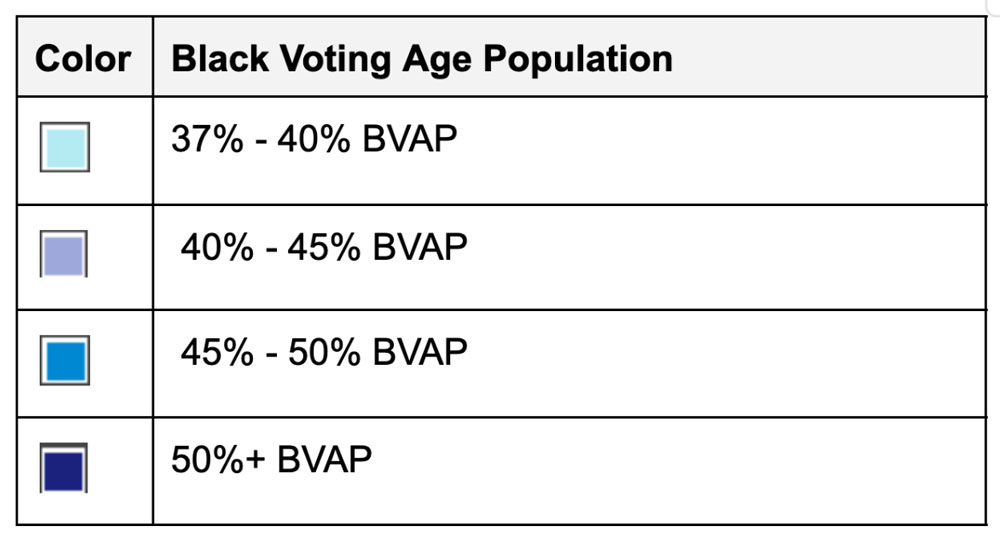
Districts 1 (Northeast NC) and 12 (Charlotte) have a Black voting age population above 37% (the threshold used by DRA to illustrate significant minority population in a district).
Black Voting Age Population of Northeast NC Congressional District
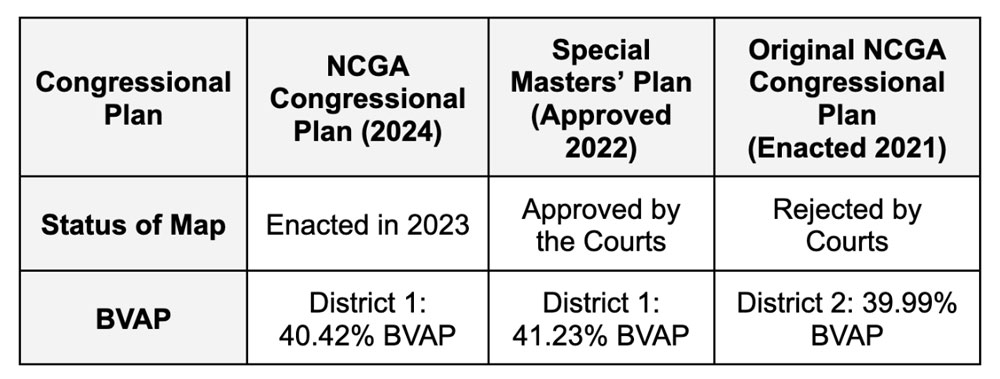
This map changes the configuration of district 1, the district which has traditionally represented the northeastern part of the state.
DRA Analytics Summary:
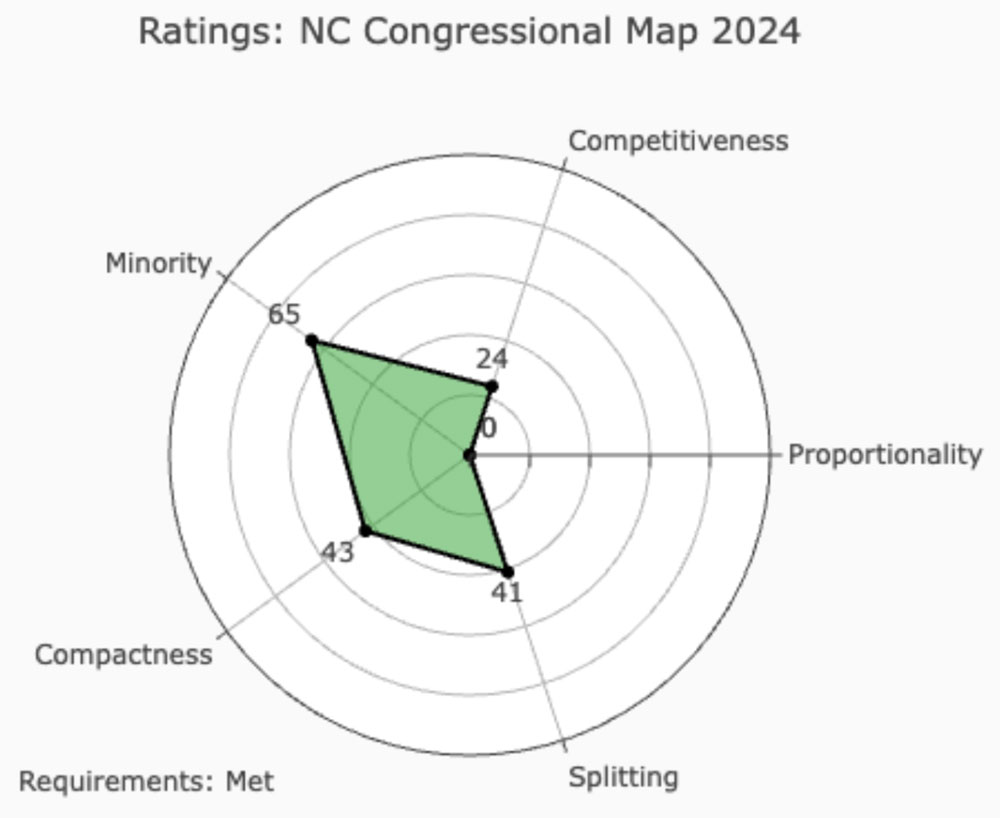
DRA examines how the map addresses 5 different criteria: Proportionality, Competitiveness, Minority Representation, Compactness, and Splitting. Its scores for each category are listed below on a 0-100 scale. A higher number indicates a better score. Note that DRA’s Minority Representation analysis does not ensure Voting Rights Act (VRA) compliance. DRA also notes that some factors like communities of interest can be hard to quantify.
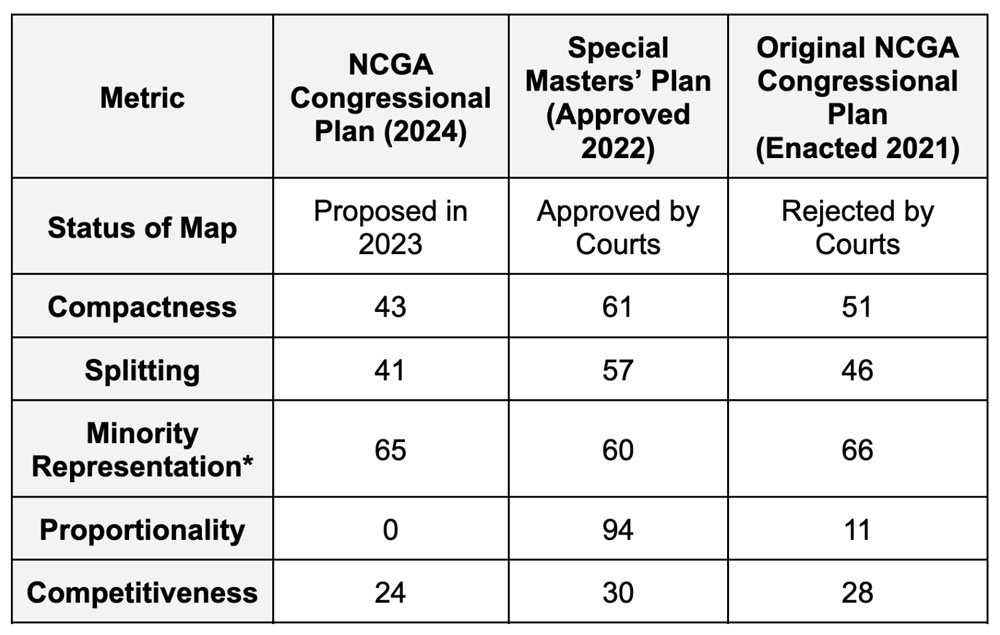
*DRA’s analysis includes a disclaimer stating that its analysis does not ensure Voting Rights Act compliance.
Proportionality is one measure of how fair a map is. In a proportional map, if 50% of North Carolinians voted for Republicans to represent them in Congress and 50% voted for Democrats, the map’s number of leaning Republican or Democratic seats should be about even. This would likely result in a 7-7 or 8-6 split among North Carolina’s Congressional delegation. The enacted 2024 map received a 0 out of 100 for proportionality, meaning it is incredibly disproportionate and will greatly favor Republicans. Therefore with the implementation of this map, a majority of North Carolinians could vote for Democrats to represent them in the US Congress, however, because of how the districts are drawn, a majority of Republicans could still get elected.
DRA Analytics Notes
- Given 14 districts, you might need to split counties 13 times for district populations to be ‘roughly’ equal.
- In this map, 11 counties are split a total of 14 times: Cabarrus (1), Chatham (1), Cumberland (1), Forsyth (1), Granville (1), Guilford (2), Mecklenburg (2), Polk (1), Robeson (1), Sampson (1), and Wake (2).
- Two counties — Mecklenburg and Wake — may have to be split, because they have more people than a district. The resulting splits could yield two single-county districts. There are two.
- To achieve almost exactly equal district populations, 13 precincts may also have to be split, but 20 are.
More Tools for Understanding the Maps
Click here for the North Carolina General Assembly’s bill page for the 2024 House map. Here you can see additional documents associated with the map and a record of which legislators sponsored and voted for or against the map.
Click here to view an interactive Google map showing the political and racial demographics of each district. The map will also allow you to type in your address to see which district you would be in.
The partisan lean of the districts in the map are color coded using the scale below:
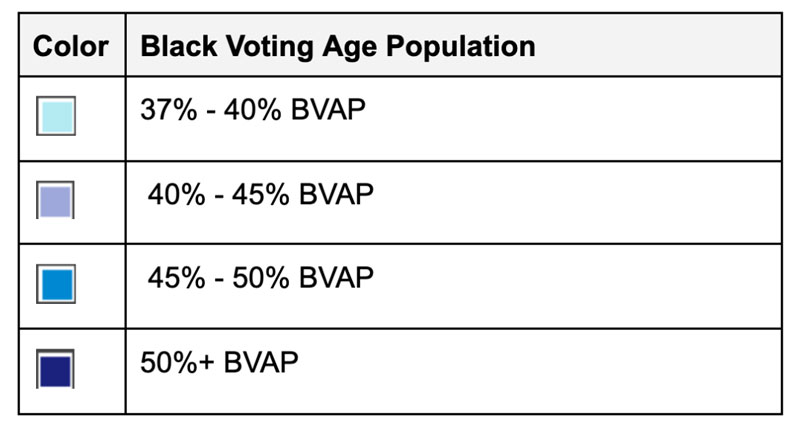
If you check “Black Voting Age Population” to view a map of these districts. The map will also allow you to type in your address to see which district you would be in. The districts in the map are color coded using the scale below and only show districts with a Black voting age population greater than 37% (the threshold used by DRA to illustrate significant minority population in a district):
For additional resources on this map and the redistricting process in North Carolina, visit the North Carolina General Assembly’s Redistricting website.
2024 NC Senate Map
Click here to view the full Dave’s Redistricting App (DRA) analysis and interactive map.
Here’s what Dave’s Redistricting analysis shows us about the 2024 NC Senate map.
Political Demographics
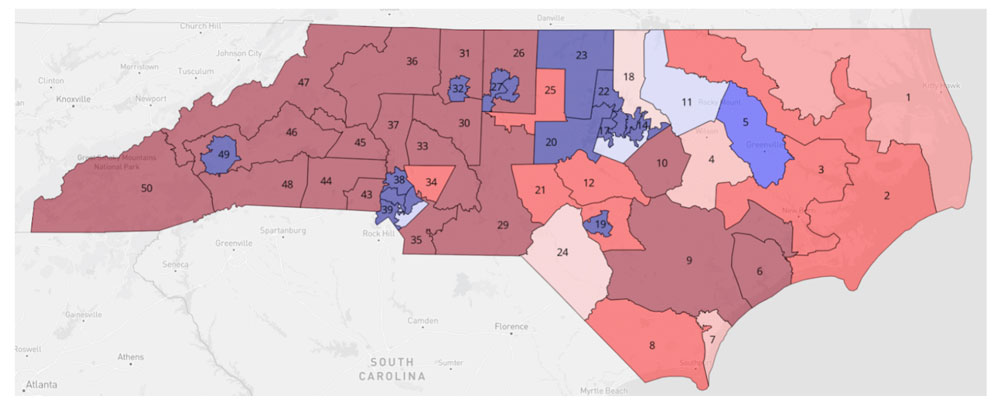
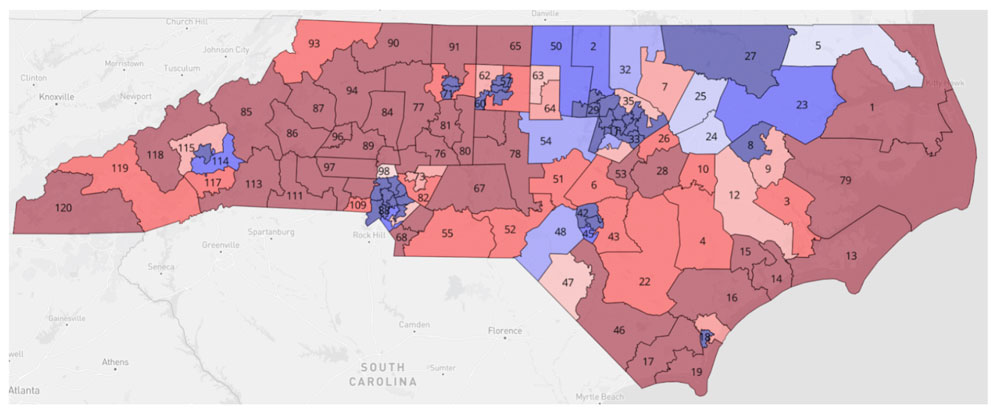
Below is a view of the Senate plan based on composite 2016-2022 election data which combines the results of several elections. The darker the shade of red or blue the safer the seat. The lighter the shade, the less safe the seat is.
 Here is a breakdown of how this map looks in numbers.
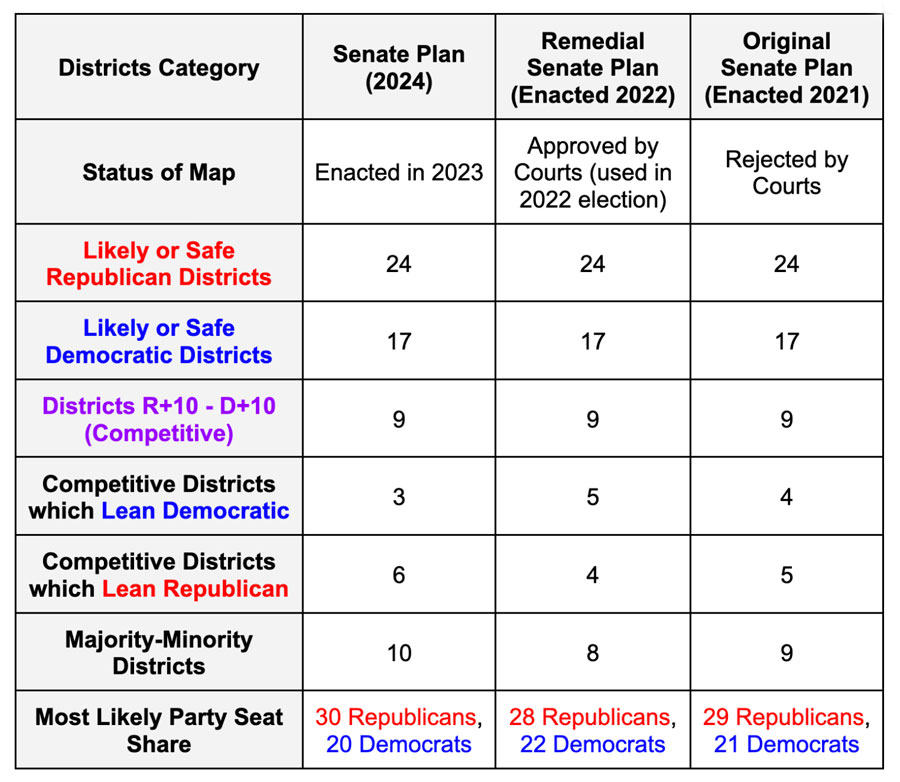
Nine of the districts are estimated to favor Republicans or Democrats by no more than 10 percentage points, meaning they are projected to be at least somewhat competitive. Another way to describe these districts is having a political lean in-between R+10 and D+10.
These are the nine competitive districts based on the DRA analysis:
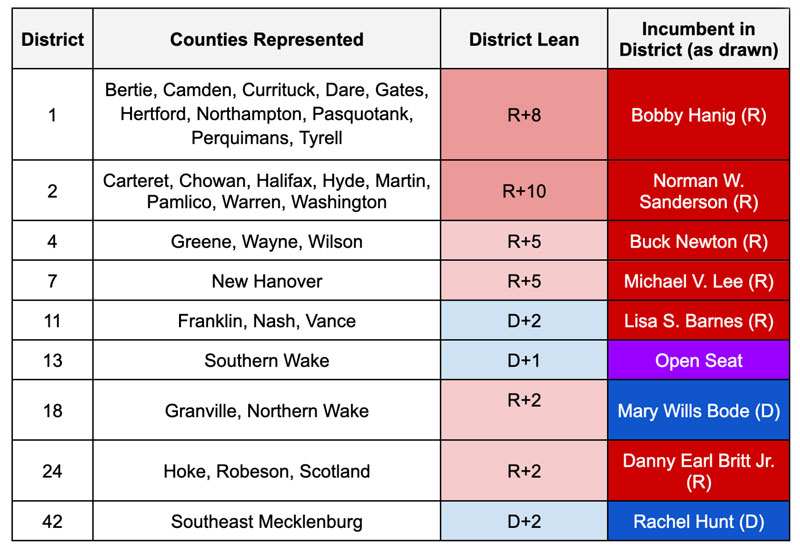
Out of the 9 districts with a Democratic vote share between 45% and 55%, 6 lean Republican and 3 lean Democratic. According to the DRA analysis, the most likely outcome of this map would be a 30-20 split in favor of the Republicans. If the map performs as DRA projects, Republicans would maintain their supermajority in the state Senate.
If Republicans won all 9 of the R+10 – D+10 seats and won all the seats projected to be safe or likely for them, they could gain a 33-17 majority. Most of the competitive seats lean Republican, and those that lean Democratic only do so by 1 or 2 percentage points. So, according to the DRA analysis of this map, it may be feasible for Republicans to increase their majority in the Senate.
If Democrats won all 9 of the R+10 – D+10 seats and won all the seats projected to be safe or likely for them, they could gain a 26-24 majority. This scenario would be extremely unlikely because most of the competitive seats lean Republican, including districts 1 and 2, which are on the very edge of the competitive range at R+8 and R+10.
Racial Demographics
This map shows how North Carolina’s Black population is spread across the districts.

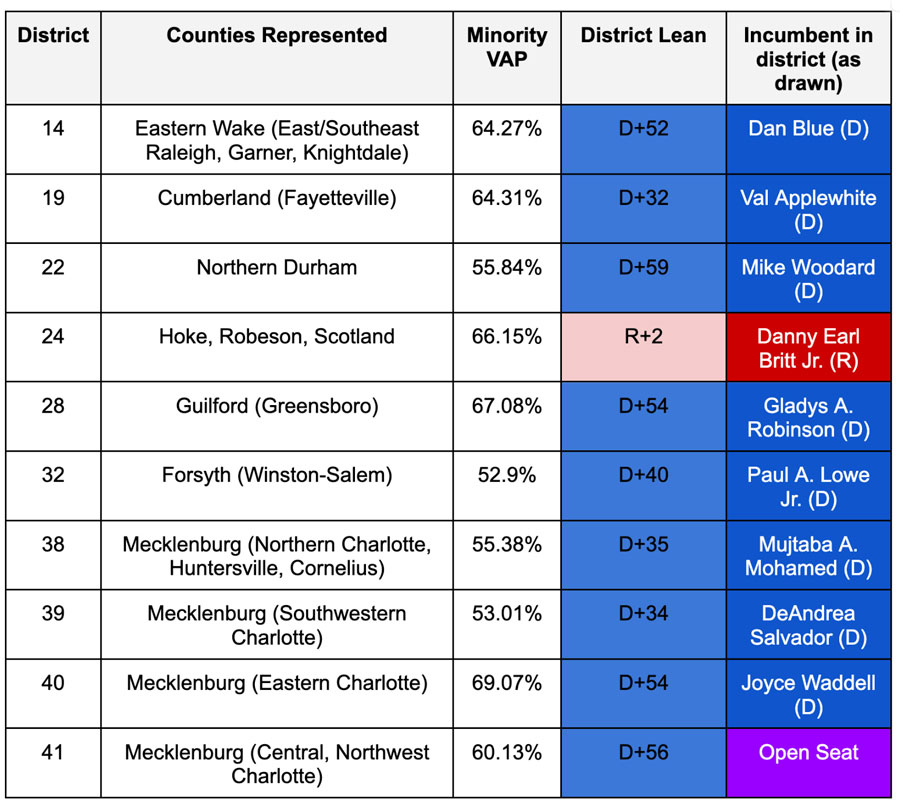
There are 7 districts with a Black voting age population over 37% (the threshold used by DRA to illustrate a significant minority population in the district):
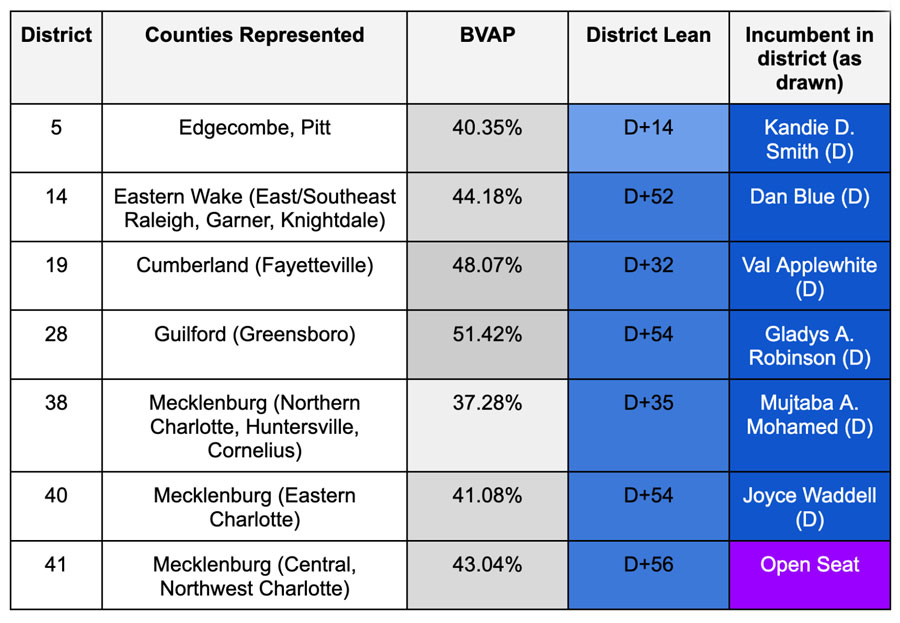
There are 10 majority-minority districts. This includes the following:
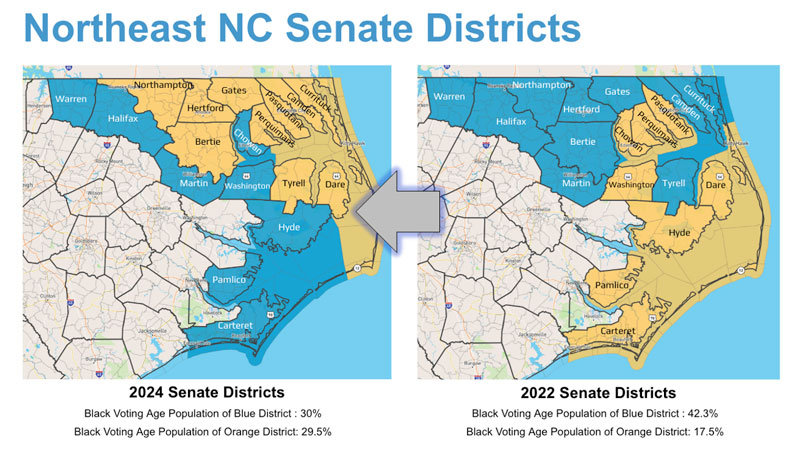
Splitting the Northeast
The maps below show how the northeast Senate districts would change based upon the new districts. Notably, the map-drawers chose county cluster groupings in the northeastern part of the state which are different from the current cluster groupings. As a result, districts 1 and 2 split the Black population in much of the northeastern part of the state – that is illustrated in the racial demographics map below.
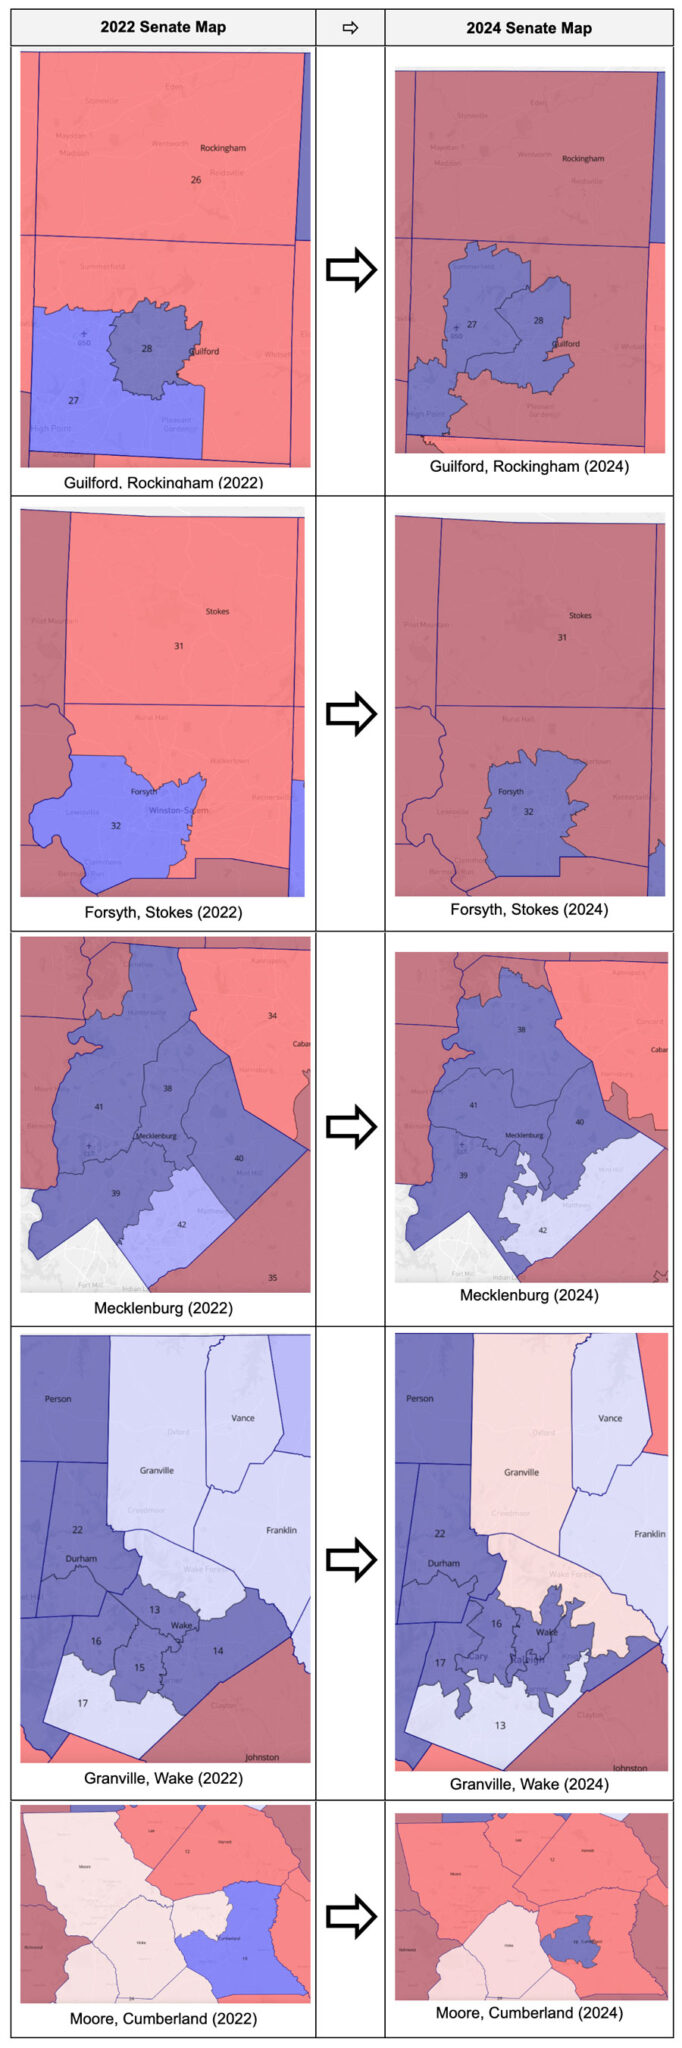
2022 Map vs. 2024 Map
Throughout the Senate map, changes were made to the districts in and surrounding the major urban areas. Several districts which were quite competitive or leaned Democratic, now are much more favorable to Republicans. Below are some examples.
For a more in-depth comparison between the 2022 maps and the 2024 maps, click here to use the Redistricting and You tool. You can compare political and racial data. It will also allow you to type in your address to see how your districts have changed.
DRA Analytics Summary
DRA examines how the map addresses 5 different criteria: Proportionality, Competitiveness, Minority Representation, Compactness, and Splitting. Its scores for each category are listed below on a 0-100 scale. A higher number indicates a better score. Note that DRA’s Minority Representation analysis does not ensure Voting Rights Act (VRA) compliance. DRA also notes that some factors like communities of interest can be hard to quantify.
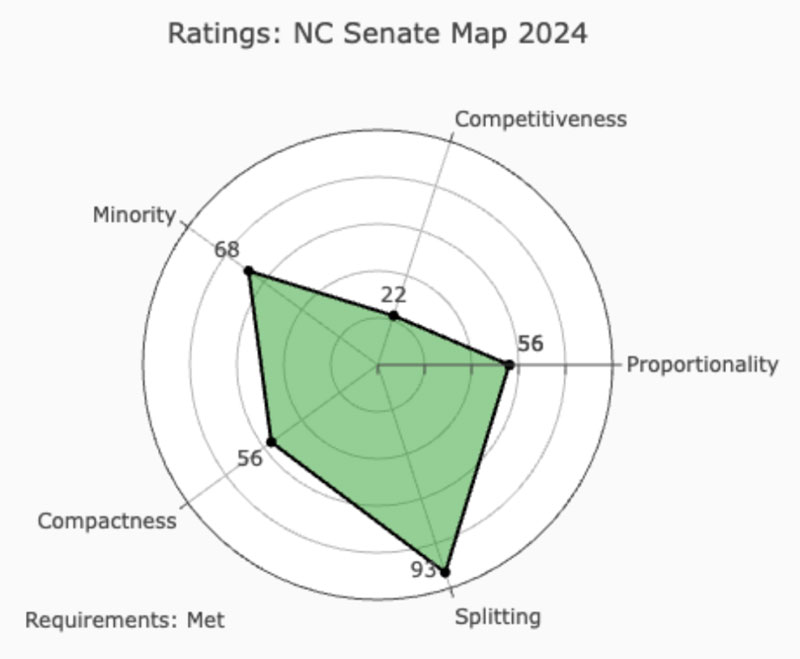
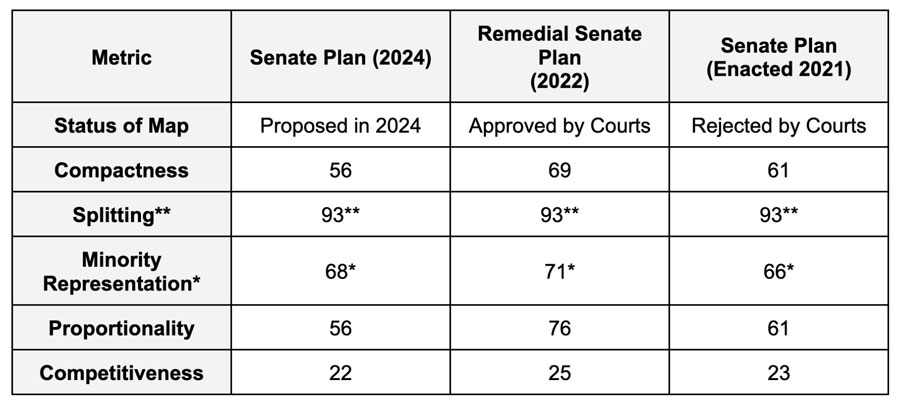
*DRA’s analysis includes a disclaimer stating that its analysis does not ensure Voting Rights Act compliance.
**Splitting measures the number of county splits in the map. North Carolina legislators are required by state law to reduce the amount of county splits to the fewest possible in the state legislative maps.
More tools for understanding the maps
Click here for the North Carolina General Assembly’s bill page for the 2024 Senate map. Here you can see additional documents associated with the map and a record of which legislators sponsored and voted for or against the map.
Click here to view an interactive Google map showing the political and racial demographics of each district. The map will also allow you to type in your address to see which district you would be in.
The partisan lean of the districts in the map are color coded using the scale below:
If you check “Black Voting Age Population” on the map it will show the districts by BVAP. The map will also allow you to type in your address to see which district you would be in. The districts in the map are color coded using the scale below and only show districts with a Black voting age population greater than 37% (the threshold used by DRA to illustrate significant minority population in a district).
For additional resources on this map and the redistricting process in North Carolina, visit the North Carolina General Assembly’s Redistricting website.
2024 NC House Map
Click here to view the full Dave’s Redistricting App (DRA) analysis and interactive map.
Here is what Dave’s Redistricting’s analysis shows us about the 2023 NC House map.
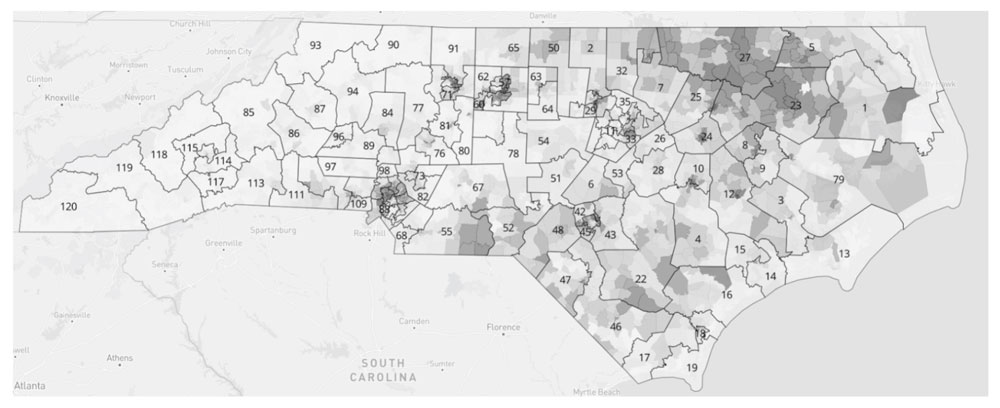
Political Demographics
Below is a view of the House plan based on composite 2016-2022 election data which combines the results of several elections. The darker the shade of red or blue the safer the seat. The lighter the shade, the less safe the seat is.
Here is a breakdown of how this map looks in numbers.
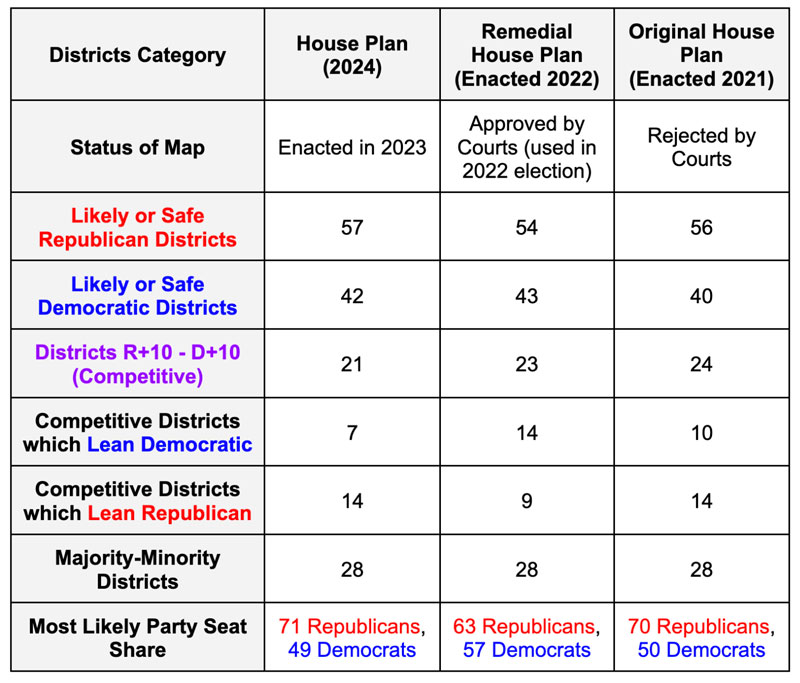
Twenty-one of the districts were estimated to favor Republicans or Democrats by no more than 10 percentage points, meaning they are projected to be at least somewhat competitive. Another way to describe these districts is having a political lean in-between R+10 and D+10.
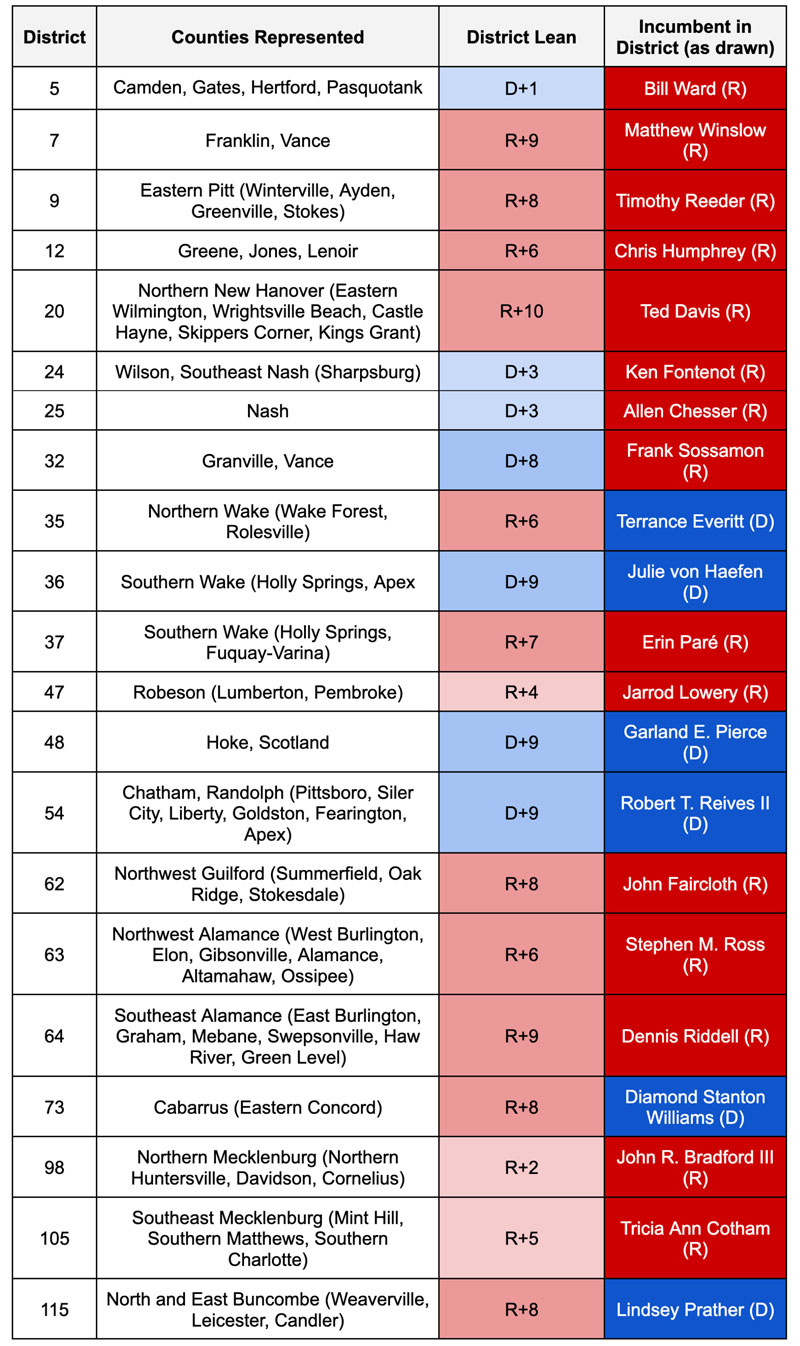
These are the 21 state House districts DRA expects to be the somewhat competitive:
Out of the 21 districts expected to be somewhat competitive, 14 lean Republican and 7 lean Democratic. According to the DRA analysis, the most likely outcome of this map would be a 71-49 split in favor of the Republicans. If the map performs as DRA projects, Republicans would be one vote shy of a supermajority in the state House.
If Republicans won all of the R+10 – D+10 districts and the districts projected to be safe or likely for them, they would increase their majority and obtain 78 seats to the Democrats’ 42 seats. This would increase the Republicans’ supermajority. With districts 32, 36, 48, and 54 projected to be D+8 or D+9 districts, this scenario would not be likely. However, several R+10 – D+10 districts only lean slightly for the Democrats, such as district 5 (D+1), district 24 (D+3), and district 25 (D+3). Districts 5, 24, and 25 are already represented by Republicans. Therefore, if Republicans were to maintain these 3 districts and win the other districts already projected to favor them, it is possible for them to increase their majority to a 74-46 split.
If Democrats won all of the R+10 – D+10 districts and the districts projected to be safe or likely for them, they would obtain a narrow 63-57 majority. This scenario would be extremely unlikely since 14 of the 21 R+10 – D+10 districts favor Republicans. Moreover, among the R+10 – D+10 districts, several are on the upper end of the competitive range. In fact, 11 of the 14 R+10 – D+10 districts that favor Republicans, do so by 6 or more percentage points.
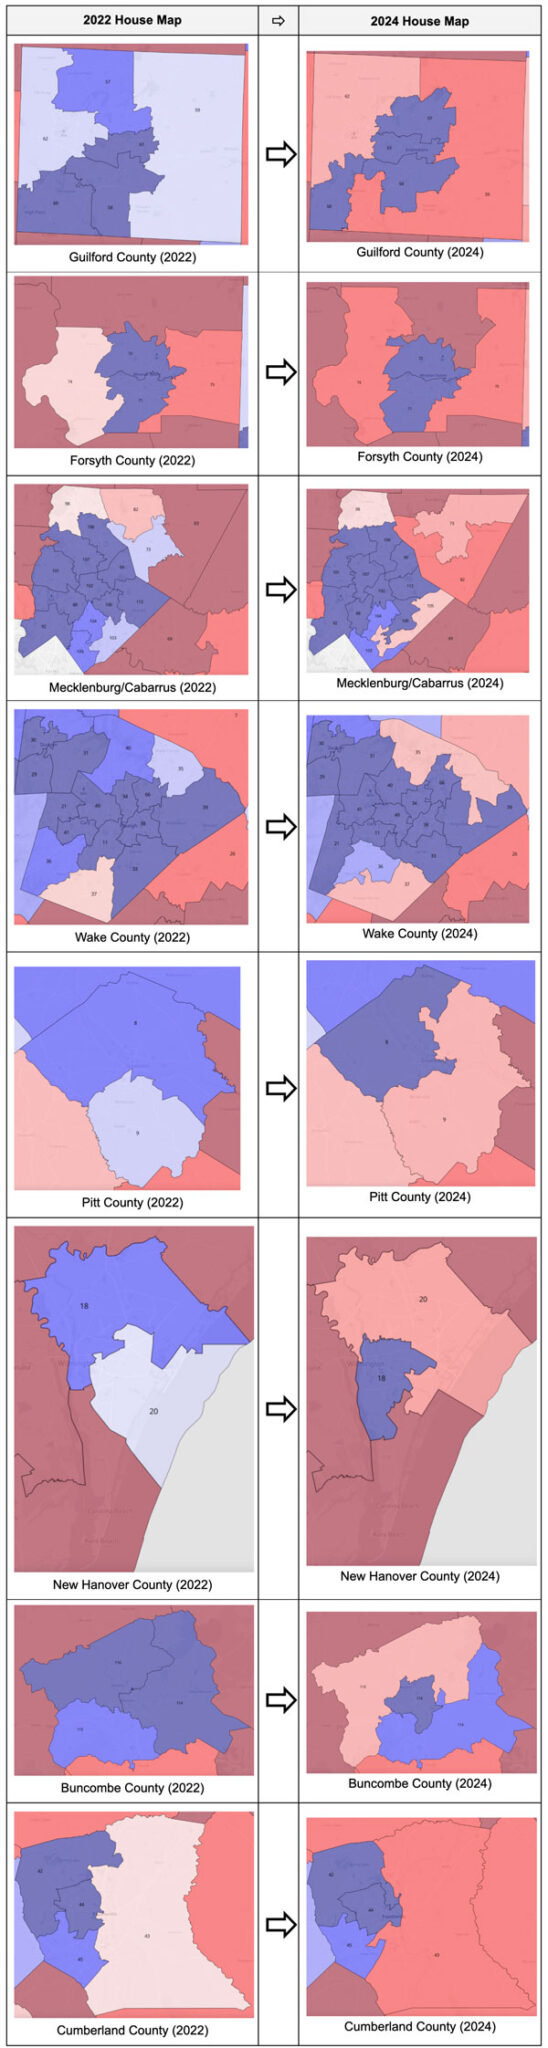
2022 Map vs. 2024 Map
Throughout the House map, changes were made to the districts in and surrounding the major urban areas. Several districts which were quite competitive or leaned Democratic, now are much more favorable to Republicans. Below are some examples.
For a more in-depth comparison between the 2022 maps and the 2024 maps, click here to use the Redistricting and You tool. You can compare political and racial data. It will also allow you to type in your address so you can see how your districts have changed.
Racial Demographics
This map shows how North Carolina’s Black population is spread across the districts:
There are 25 districts with a Black voting age population over 37% (the threshold used by DRA to illustrate a significant minority population in the district). In 4 of the districts, the majority of the voting age population is Black. This includes districts 23 (Edgecombe, Martin, Bertie), 27 (Warren, Halifax, Northampton), 58 (Southern Greensboro), and 107 (North-Central Charlotte).
District 47 (Robeson County) has a Native American voting age population of 47% and includes part of the Lumbee Tribe.
Districts 21 (Western Apex, Southwest Wake County) and 41 (Northern Cary, Morrisville, Brier Creek) both have a relatively high Asian voting age population at 26.65% and 33.18% respectively.
DRA Analytics
DRA examines how the map addresses 5 different criteria: Proportionality, Competitiveness, Minority Representation, Compactness, and Splitting. Its scores for each category are listed below on a 0-100 scale. A higher number indicates a better score. Note that DRA’s Minority Representation analysis does not ensure Voting Rights Act (VRA) compliance. DRA also notes that some factors like communities of interest can be hard to quantify.
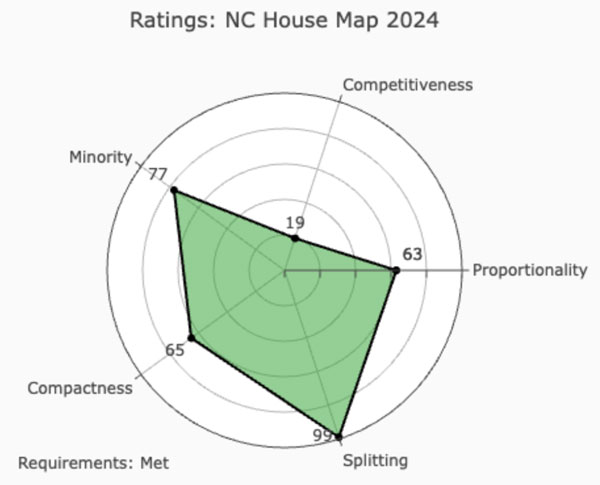
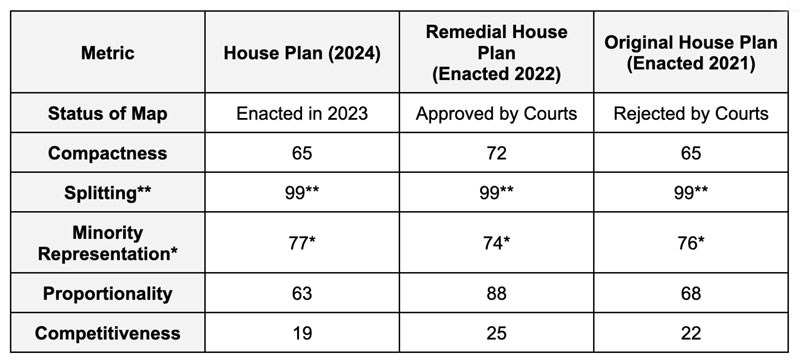
*DRA’s analysis includes a disclaimer stating that its analysis does not ensure Voting Rights Act compliance.
**Splitting measures the number of county splits in the map. North Carolina legislators are required by state law to reduce the amount of county splits to the fewest possible in the state legislative maps.
More Tools for Understanding the Maps
Click here for the North Carolina General Assembly’s bill page for the 2024 House map. Here you can see additional documents associated with the map and a record of which legislators sponsored and voted for or against the map.
Click here to view an interactive Google map showing the political and racial demographics of each district. The map will also allow you to type in your address to see which district you would be in.
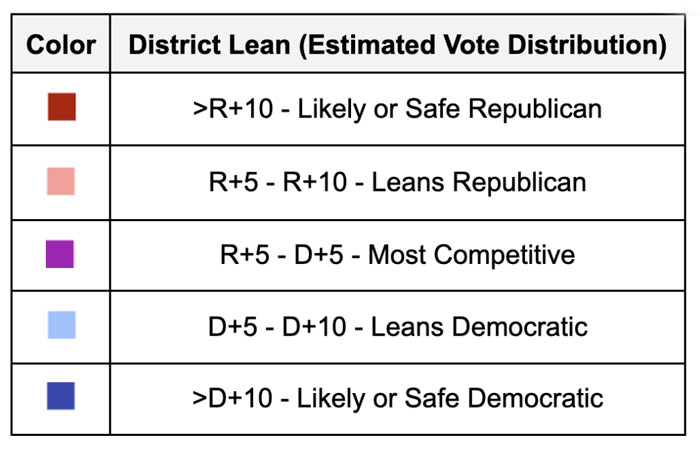
The partisan lean of the districts in the map are color coded using the scale below:
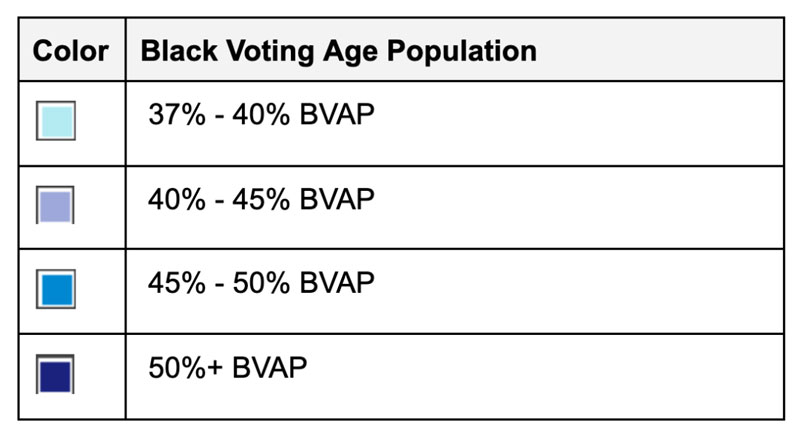
If you check “Black Voting Age Population” on the map it will show the districts by BVAP. The map will also allow you to type in your address to see which district you would be in. The districts in the map are color coded using the scale below and only show districts with a Black voting age population greater than 37% (the threshold used by DRA to illustrate a significant minority population in the district):
For additional resources on this map and the redistricting process in North Carolina, visit the North Carolina General Assembly’s Redistricting website.