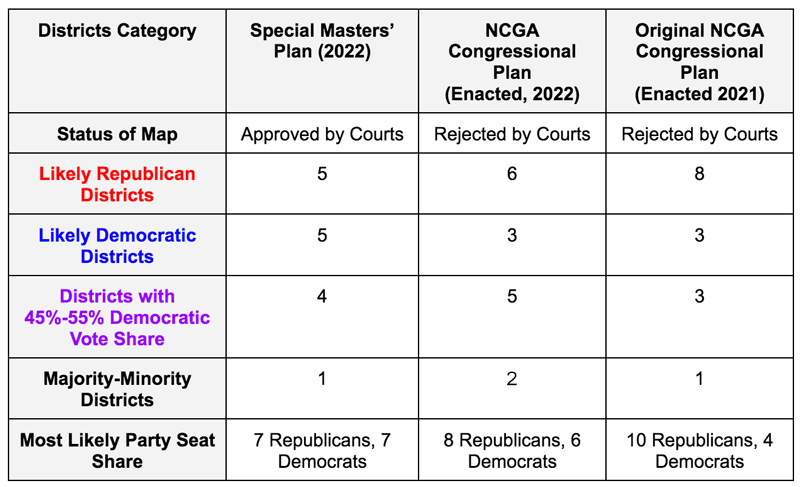
DRA analysis of court-approved remedial maps
In order to further public transparency about redistricting in North Carolina and allow for public review, Common Cause has uploaded remedial maps approved by the state court into Dave’s Redistricting Application (DRA). This information is provided for public education only, and the analysis here reflects that generated by the DRA program and does not constitute an opinion on or endorsement of these maps by Common Cause.
Click on the map name below to jump to its analysis section:
2022 NC Interim Congressional Map

Click here to view the full DRA analysis and interactive map.
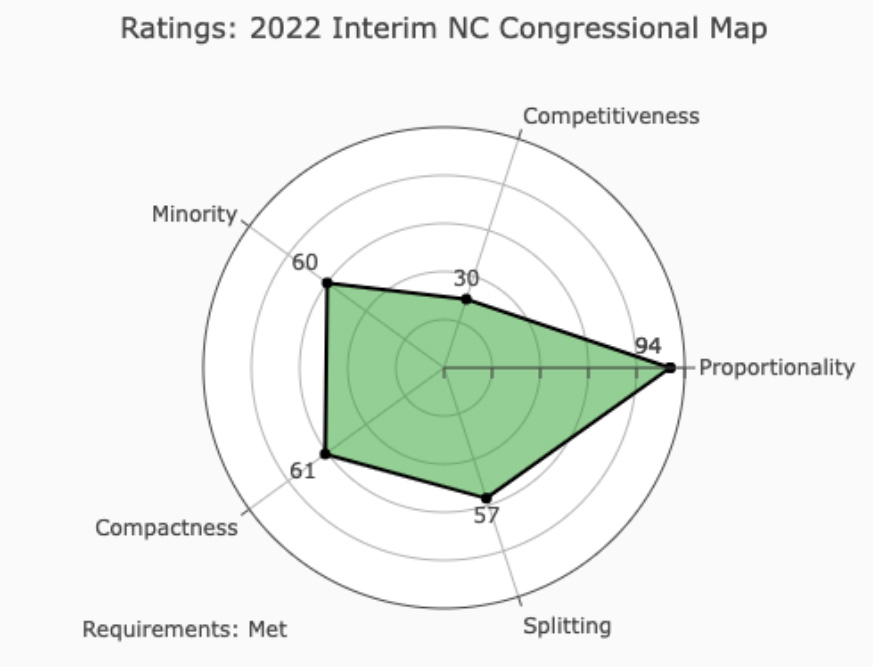
The DRA Analysis shows:
DRA Analytics:
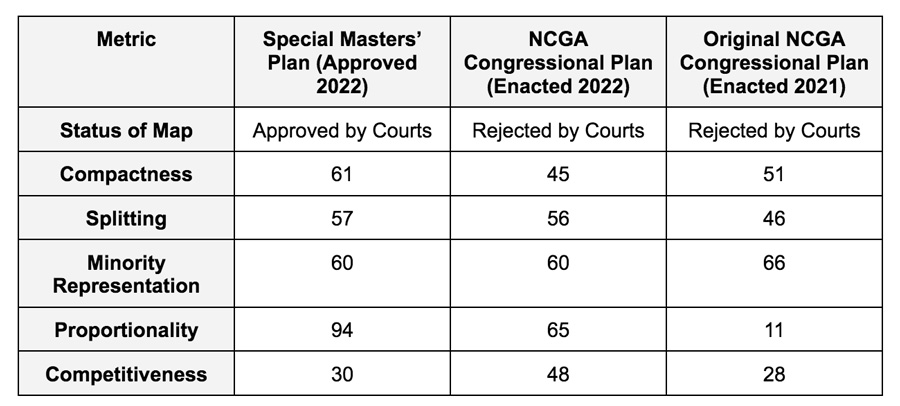
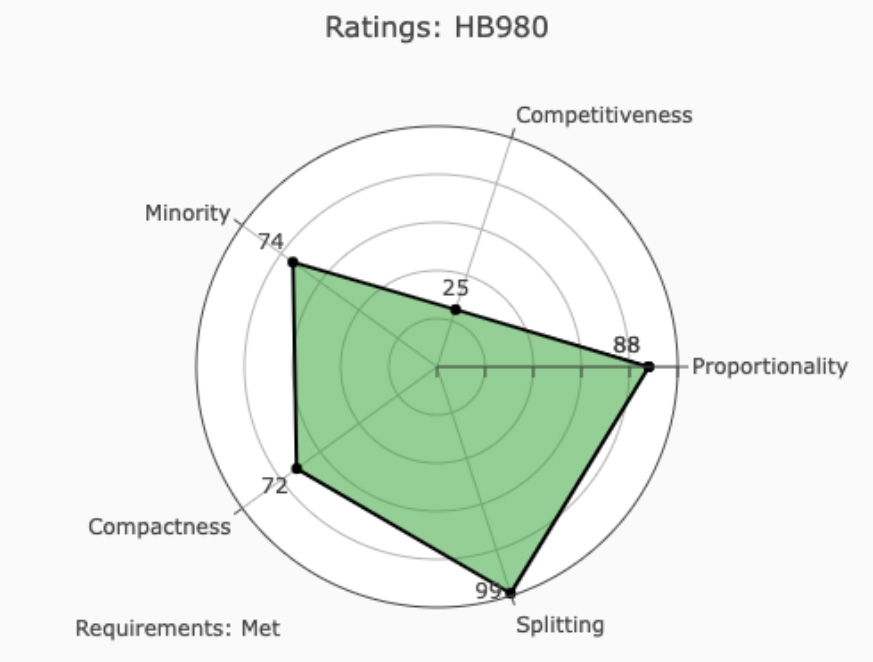
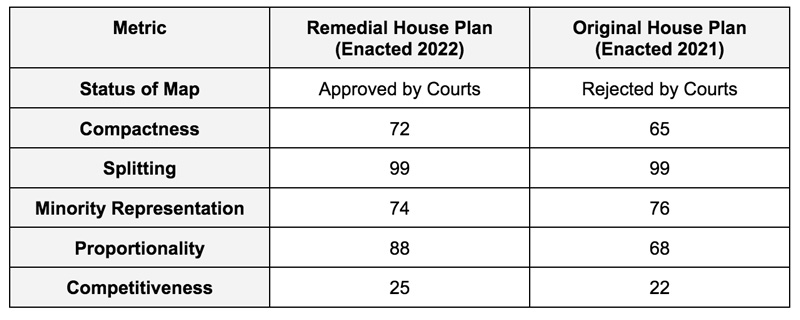
DRA examines how the map addresses 5 different criteria: Proportionality, Competitiveness, Minority Representation, Compactness, and Splitting. Its scores for each category are listed below on a 0-100 scale. A higher number indicates a better score. Note that DRA’s Minority Representation analysis does not ensure Voting Rights Act (VRA) compliance. DRA also notes that some factors like communities of interest can be hard to quantify.
Below is a view of the House plan based on composite 2016-2020 election data which combines the results of several elections. The darker the shade of red or blue the safer the seat. The lighter the shade, the less safe the seat is.
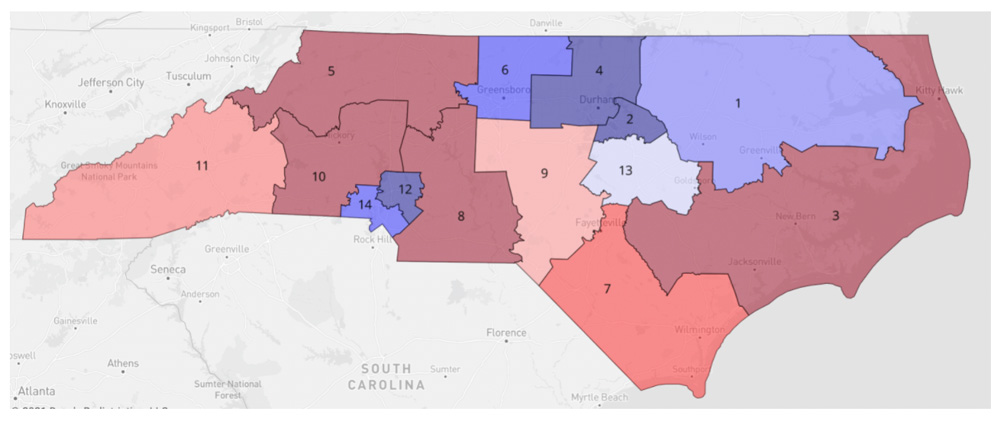
To rate the districts, DRA uses the Democratic vote share. The rank votes graph below illustrates the Democratic vote share in each district. Five of the districts had a Democratic vote share between 45% and 55%. This includes district 1, district 9, district 11, and district 13. To learn more about how the rank votes graph works, click here.
![]()
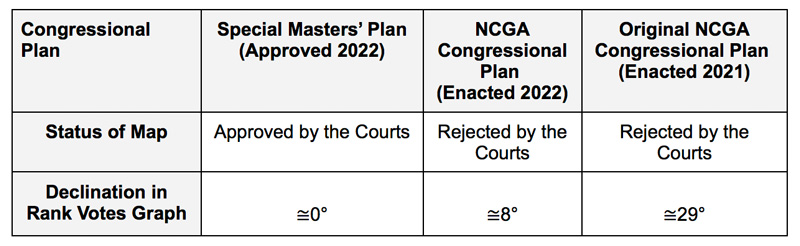
The declination (indicated by the white circle in the rank votes graph) of this congressional plan is lower than both those enacted by the North Carolina legislature. The bigger the declination, the greater the partisan bias of the plan.
Out of the 4 districts with a democratic vote share between 45% and 55%, 2 lean Republican and 2 lean Democratic. According to the DRA analysis, the most likely outcome of this map would be a 7-7 split, 7 Democrats, 7 Republicans.
This map shows how North Carolina’s Black population is spread across the districts:
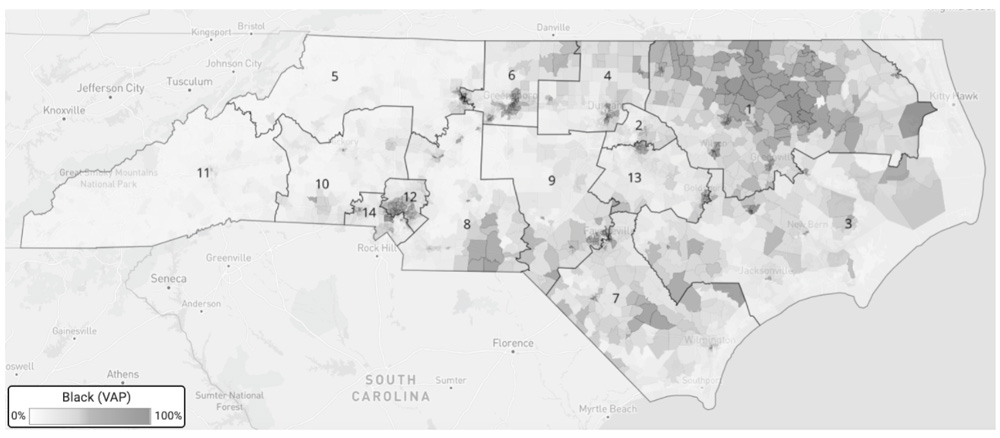
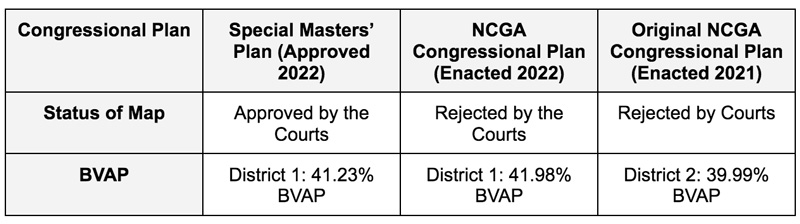
District 1 has a Black voting age population of 41.23%. It is the only district with a Black voting age population above 37%. Districts 1 is the only majority-minority district.
Black Voting Age Population of Northeast NC Congressional District:
Remedial NC Senate Map
Click here to view the full DRA analysis and interactive map.
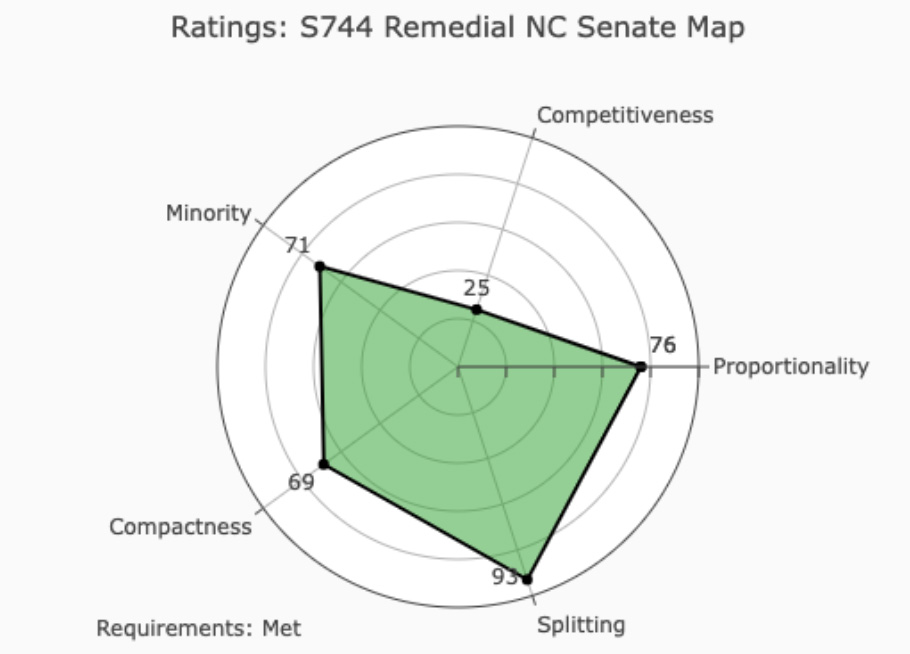
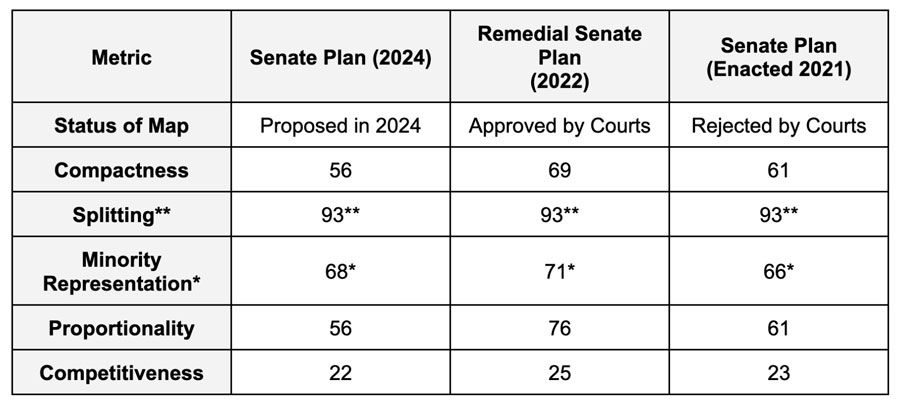
The DRA Analysis shows:

DRA Analytics:
DRA examines how the map addresses 5 different criteria: Proportionality, Competitiveness, Minority Representation, Compactness, and Splitting. Its scores for each category are listed below on a 0-100 scale. A higher number indicates a better score. Note that DRA’s Minority Representation analysis does not ensure Voting Rights Act (VRA) compliance. DRA also notes that some factors like communities of interest can be hard to quantify.
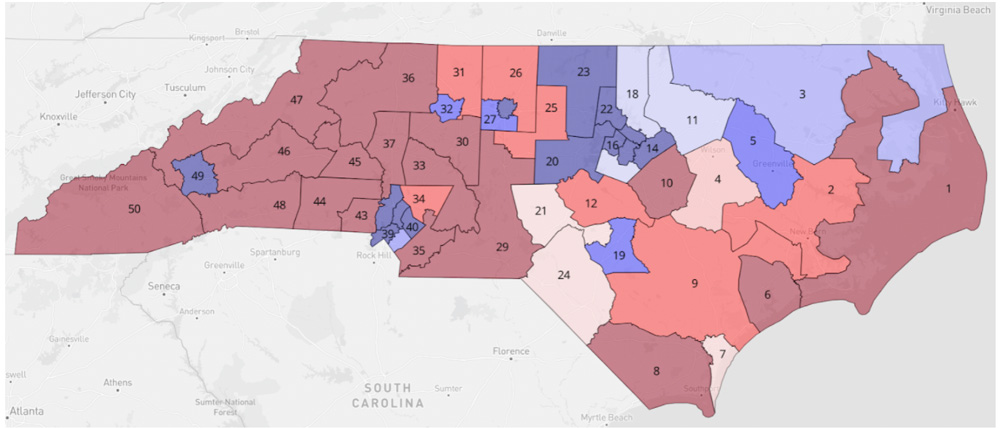
Below is a view of the Senate plan based on composite 2016-2020 election data which combines the results of several elections. The darker the shade of red or blue the safer the seat. The lighter the shade, the less safe the seat is.
To rate the districts, DRA uses the Democratic vote share. The rank votes graph below illustrates the Democratic vote share in each district. Nine of the districts had a Democratic vote share between 45% and 55%. This includes:
- District 3 (Warren, Halifax, Northampton, Hertford, Martin, Bertie, Camden, Currituck, Tyrell, and Gates counties)
- District 4 (Wilson, Greene, and Wayne counties),
- District 7 (most of New Hanover County),
- District 11 (Vance, Franklin, Nash),
- District 17 (southern Wake County),
- District 18 (Granville County and northern Wake County),
- District 21 (Moore County and northwest Cumberland County),
- District 24 (Scotland, Hoke, and Robeson counties)
- District 42 (southern Mecklenburg County)
To learn more about how the rank votes graph works, click here.
![]()
Out of the 9 districts with a Democratic vote share between 45% and 55%, 4 lean Republican and 5 lean Democratic. According to the DRA analysis, the most likely outcome of this map would be a 28-22 split in favor of the Republicans.
This map shows how North Carolina’s Black population is spread across the districts:
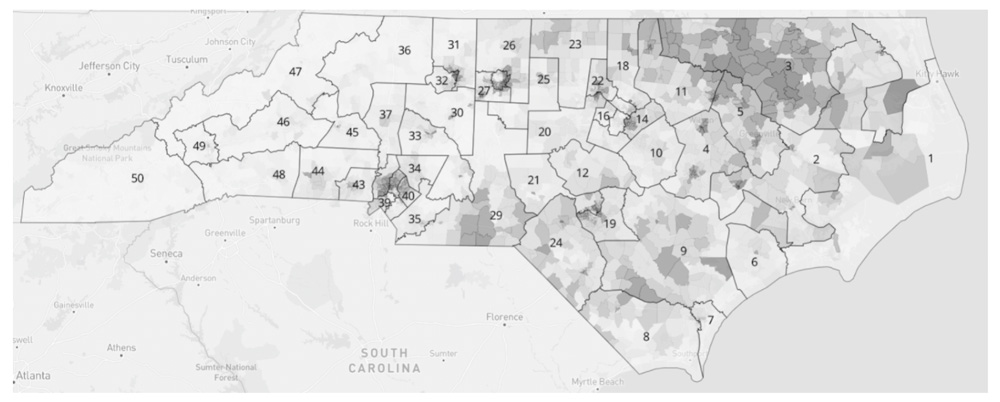
There are 8 districts with a Black voting age population over 37%. This includes:
- District 3 (Warren, Halifax, Northampton, Hertford, Martin, Bertie, Camden, Currituck, Tyrell, and Gates counties),
- District 5 (Pitt, Edgecombe),
- District 14 (eastern Wake County),
- District 19 (Cumberland County),
- District 28 (Greensboro, central Guilford County)
- District 38 (central and northeastern Mecklenburg County)
- District 40 (eastern Mecklenburg County
- District 41 (northern and western Mecklenburg County)
There are 8 majority-minority districts. This includes:
- District 14 (eastern Wake County)
- District 19 (Cumberland County)
- District 22 (central and northern Durham County)
- District 24 (Scotland, Hoke, and Robeson counties)
- District 28 (Greensboro, central Guilford County)
- District 38 (central and northeastern Mecklenburg County)
- District 40 (eastern Mecklenburg County
- District 41 (northern and western Mecklenburg County)
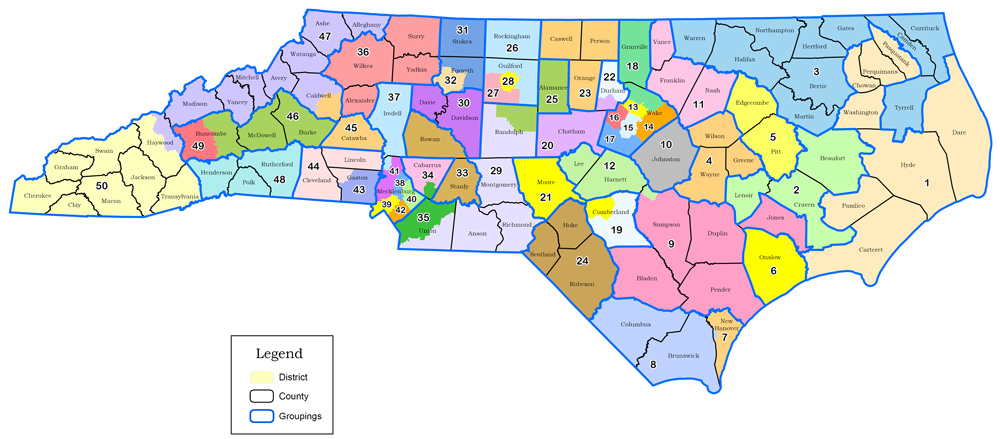
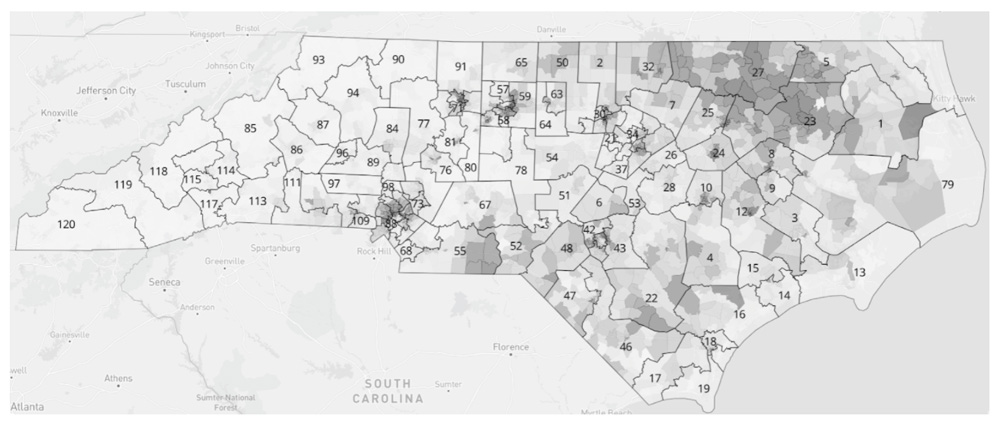
Remedial NC House Map
Click here to view the full DRA analysis and interactive map.
The DRA Analysis shows:

DRA Analytics:
DRA examines how the map addresses 5 different criteria: Proportionality, Competitiveness, Minority Representation, Compactness, and Splitting. Its scores for each category are listed below on a 0-100 scale. A higher number indicates a better score. Note that DRA’s Minority Representation analysis does not ensure Voting Rights Act (VRA) compliance. DRA also notes that some factors like communities of interest can be hard to quantify.
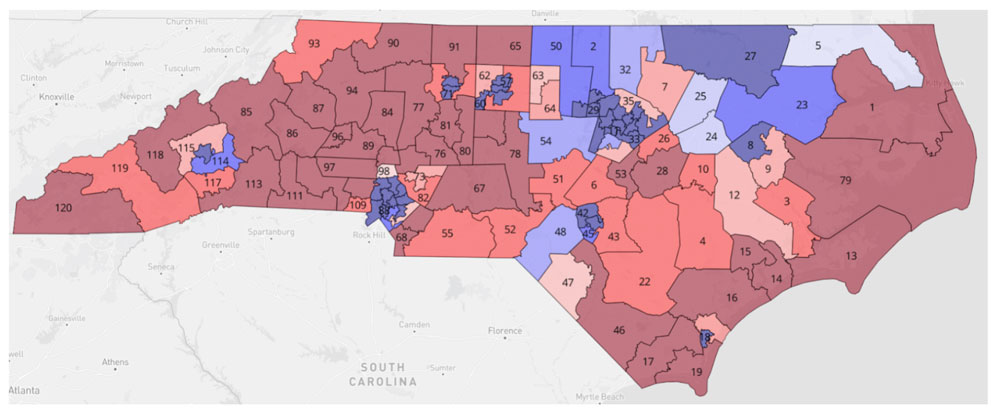
Below is a view of the House plan based on composite 2016-2020 election data which combines the results of several elections. The darker the shade of red or blue the safer the seat. The lighter the shade, the less safe the seat is.
To rate the districts, DRA uses the Democratic vote share. The rank votes graph below illustrates the Democratic vote share in each district. Twenty-three of the districts had a Democratic vote share between 45% and 55%. To learn more about how the rank votes graph works, click here.
![]()
Out of the 23 districts with a democratic vote share between 45% and 55%, 9 lean Republican and 14 lean Democratic. According to the DRA analysis, the most likely outcome of this map would be a 63-57 split in favor of the Republicans.
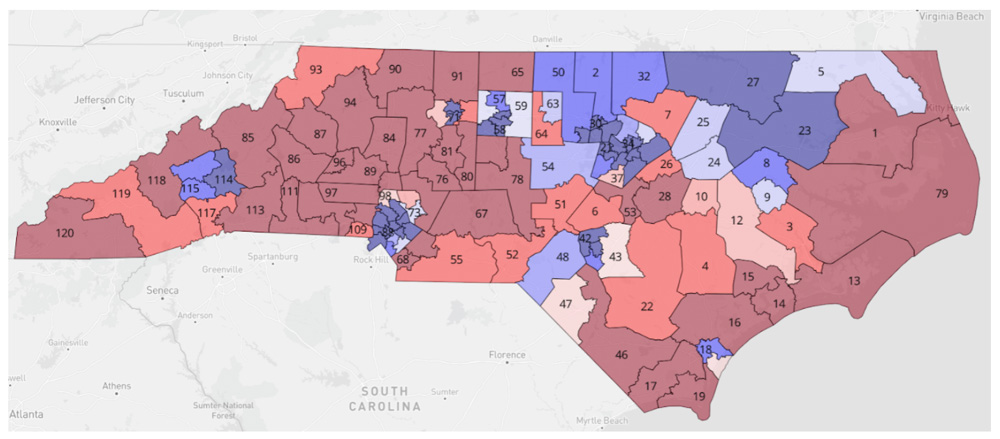
This map shows how North Carolina’s Black population is spread across the districts:
There are 21 districts with a Black voting age population of 37% or higher. In 4 of the districts, the majority of the voting age population is Black. This includes:
- District 23 (Edgecombe, Martin, and Bertie counties)
- District 27, (Warren, Halifax, and Northampton counties)
- District 101 (part of western Mecklenburg County)
- District 107 (part of northern and north central Mecklenburg County)
District 21 (Morrisville and northwestern Cary) has an Asian voting age population of 42%.
District 47 (Robeson County) has a Native American voting age population of 47%.
See More: Gerrymandering & Representation