8 Charts That Show How Political Spending Has Exploded Since Citizens United
8 Charts That Show How Political Spending Has Exploded Since Citizens United
Today marks 5 years since the Citizens United Supreme Court ruling. These 8 charts show how money in elections has exploded since then.
1) In the first presidential election since the Citizens United decision, spending in federal elections by outside groups tripled.
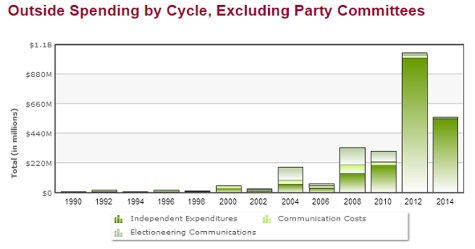
Source: Center for Responsive Politics
2) Federal election spending by dark money political 501(c)(4) nonprofits grew drastically from $1.2 million in 2006 to $257 million in 2012.
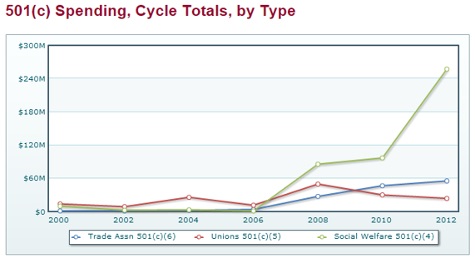
Source: Center for Responsive Politics
3) Between 2000 and 2012, the amount members of Congress received from large donors increased on average, while the amount they receive from small donors has decreased.
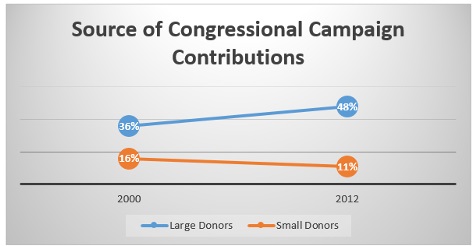
Source: Common Cause analysis of data from the Center for Responsive Politics
4) Between 2000 and 2012, the amount of special interest campaign contributions from all sectors increased, but the amount corporate special interests contributions more than doubled.
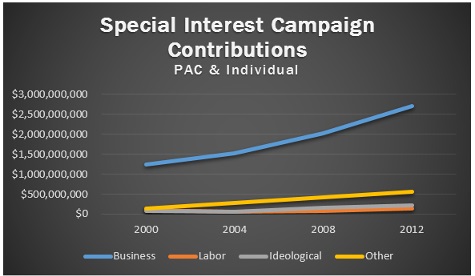
Source: Common Cause analysis of data from the Center for Responsive Politics
5) It’s happening in the states too. In the 2014 election, the 1.5 million TV ads in state races cost $856 million.
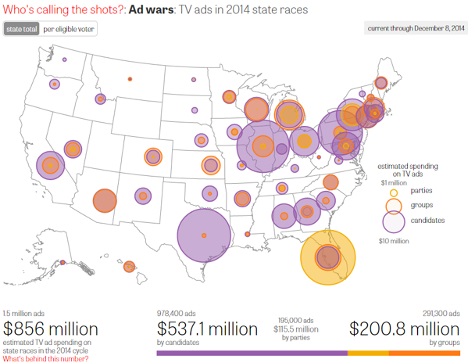
Source: Center for Responsive Politics
6)
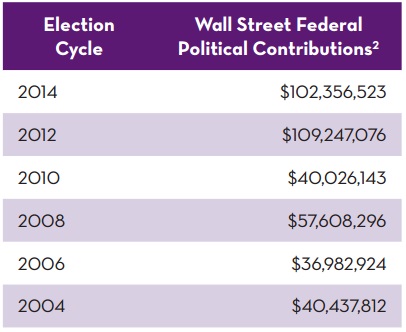
Source: Common Cause analysis of data from the Center for Responsive Politics
7) In the 2006 midterms, independent expenditures accounted for about 66% of the NRA’s total federal political spending. During the 2014 cycle, that number grew to 97%.
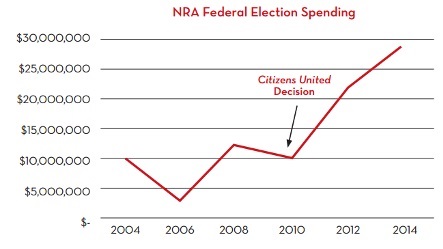
Source: Center for Responsive Politics
8)
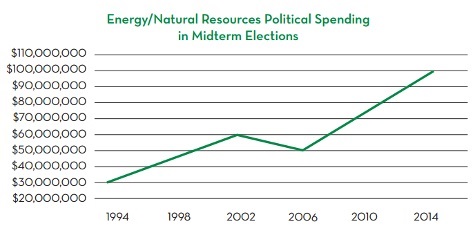
This is the impact five years has had. Those lines are moving up pretty steadily – and our democracy is worse to show for it